Impact CalculatorEvent Economic Impact — Estimated, Explained
Model the event before it happens, update the estimate as plans change, and report the final impact with every assumption, filter and calculation visible.
No black-box headline number. No rebuilding the model every time the plan changes. And no five-figure study for every event scenario.
Cities need an estimate before they approve the bid. Funders want a case before they commit. Organisers need a forecast before ticket sales, hotel nights, partner budgets and final visitor numbers are known.
So the estimate has to begin with assumptions. That is not the problem.
The problem is building an estimate from assumptions nobody can trace, test, update, or explain.
A spreadsheet may produce a number.
A consultant may produce a report.
But when the event plan changes, you can still be left asking: which assumptions changed? What was removed? Was anything counted twice? How much of the spending was truly new — and how much was likely to stay in the host economy?
This is what separates the calculator from a one-off post-event report. The same model carries the number from the first forecast to the final result.
Test whether the opportunity is worth pursuing. Compare event scenarios. Support the bid. Build the funding case. Set visitor and local spending targets.
Replace early assumptions with ticket sales, hotel forecasts, confirmed budgets, supplier locations and partner spending. Watch each change move the result.
Add final data and complete the impact estimate — without starting the whole process again. You finish a process that began when the event was still an opportunity.
A large impact figure looks good in a bid, a funding paper, or a press release. The real test starts the moment someone asks what sits behind it.
Most impact estimates give you the answer at the end. They do not give you a clear way to explain the journey.
The Event Economic Impact Calculator turns your assumptions into a visible chain of logic — one you can improve as the event develops, and stand behind when the decisions are made.
Map visitor groups, spending, organiser budget and partner inflows. Every step has a short guide and expert defaults. You need numbers you can explain — not perfect data.
Local spending is separated. Out-of-area spend is removed. VAT is handled. Leakage is accounted for. Internal transfers are counted once. Organiser income is not automatically treated as impact.
Six consistency checks test your inputs against each other. The model tracks which values are defaults and which are yours. When the questions come, you can show the full path.

See it yourself through 3 different worked cases: Championships, Festival and Congress.
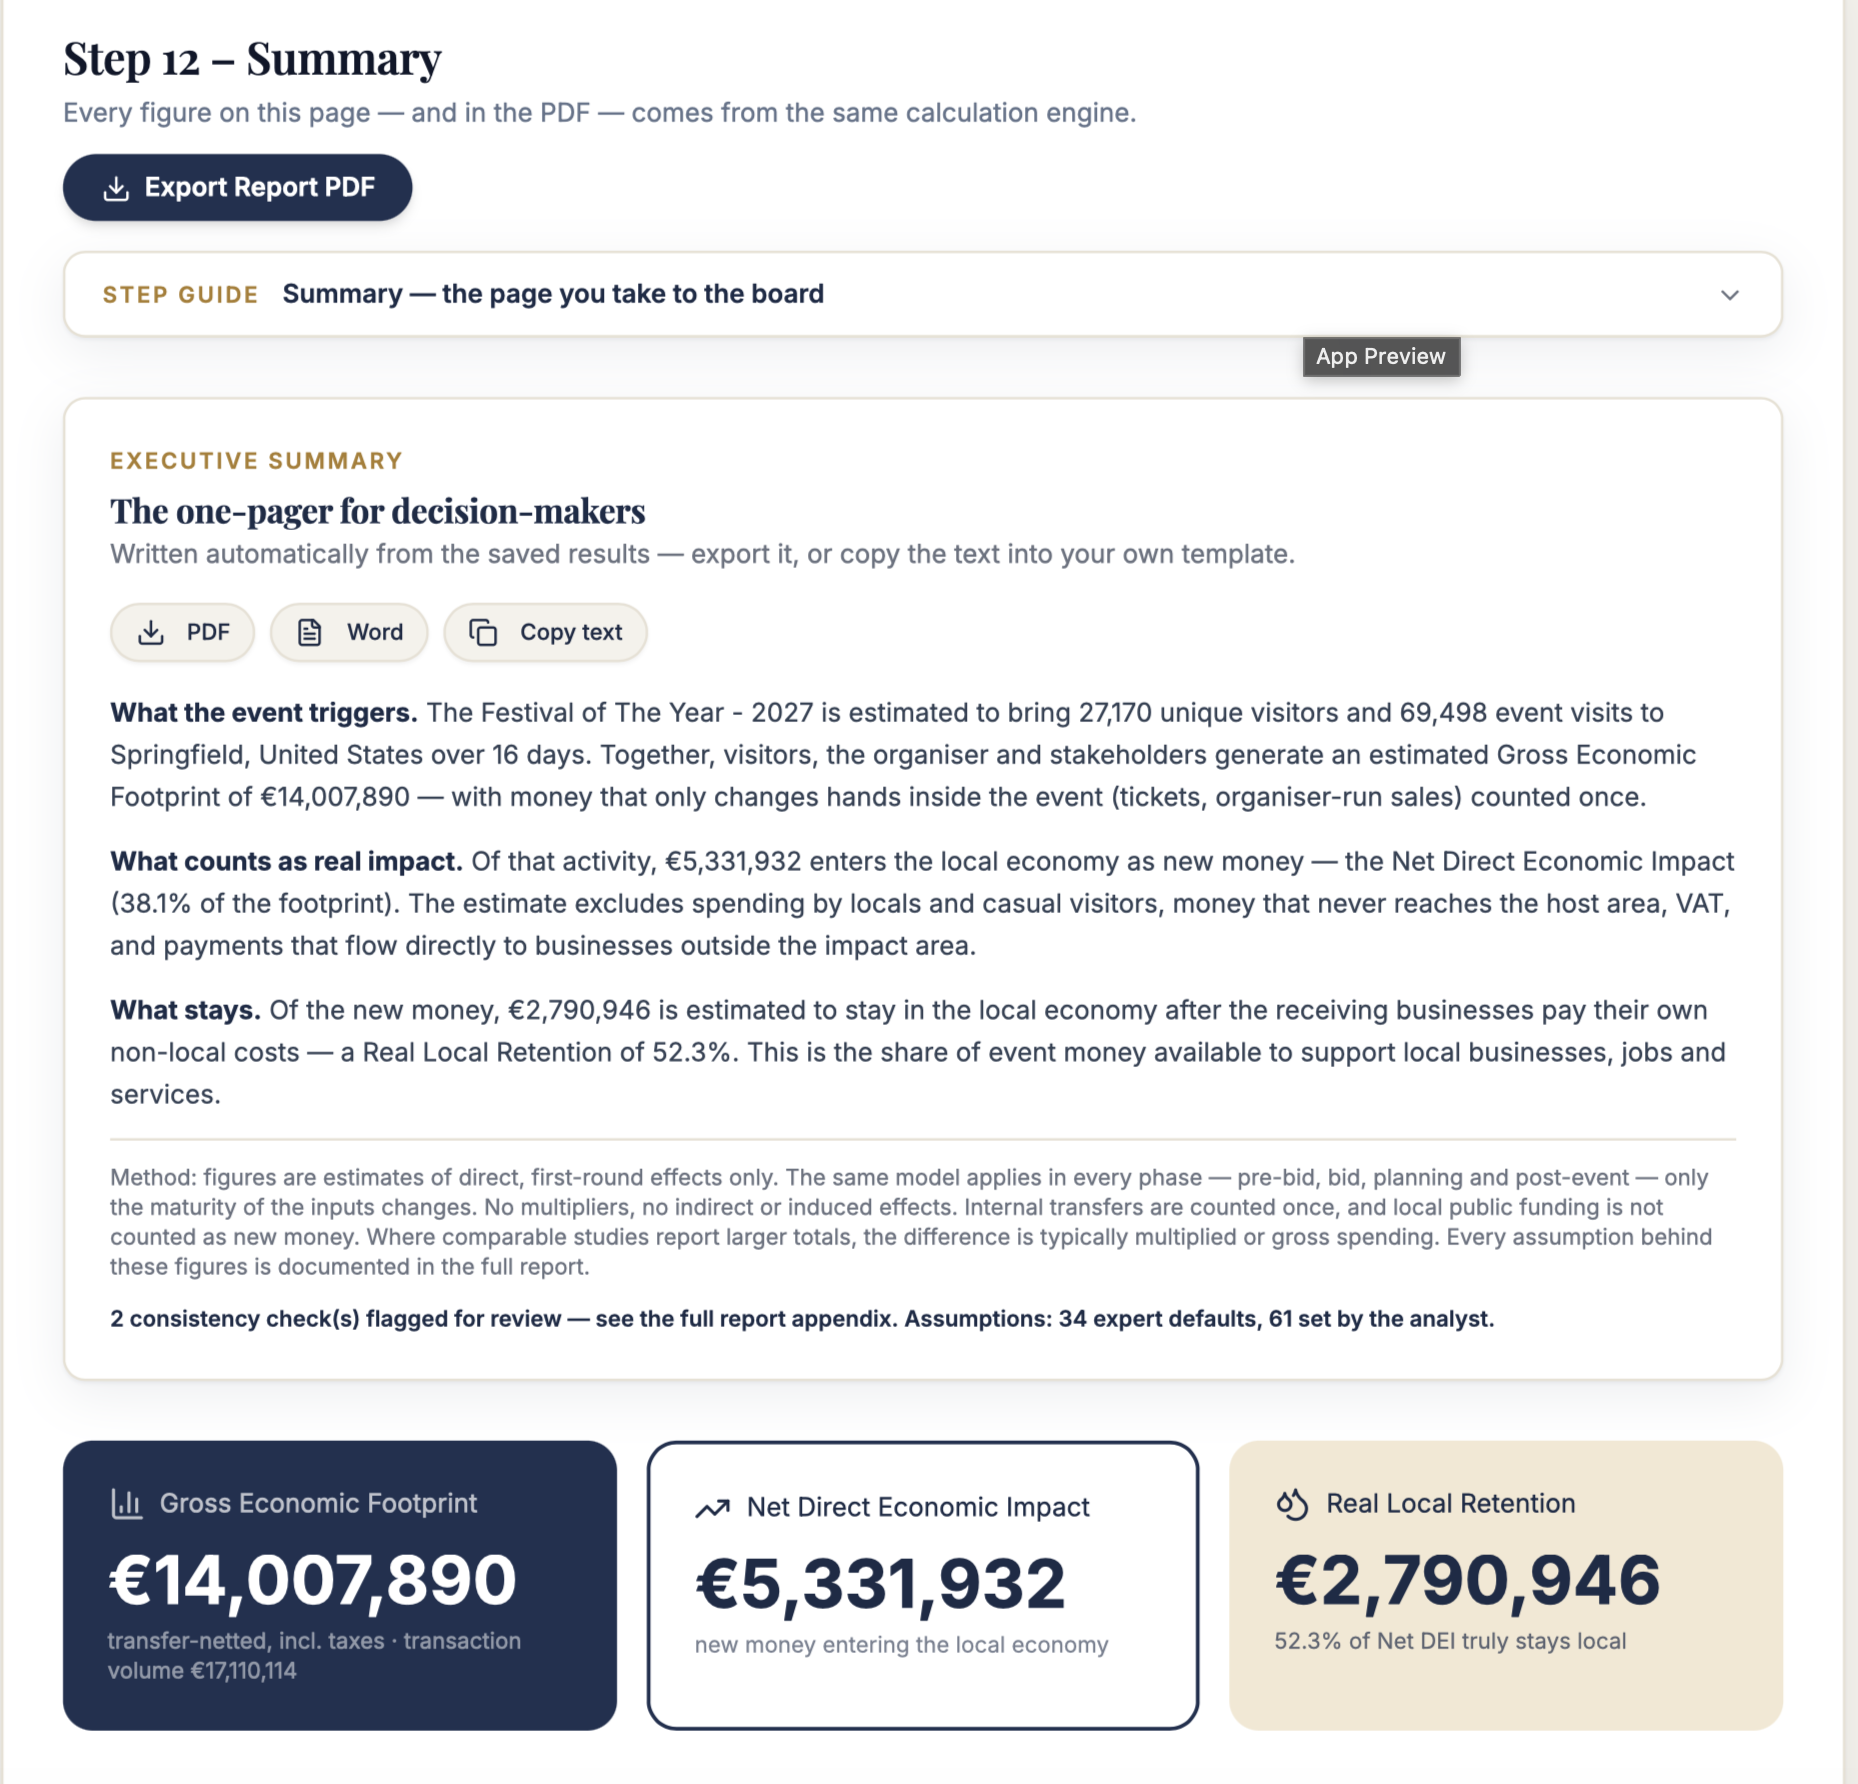
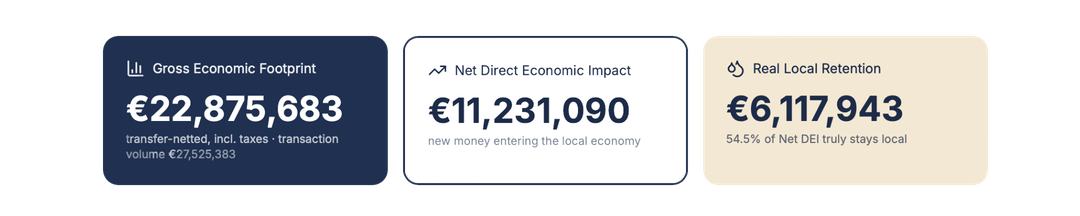
See the live demo →The total scale of event-linked economic activity — visitors, organiser and stakeholders, with internal transfers counted once.
The new money estimated to enter the host economy because the event happens — after locals, out-of-area spend, VAT and leakage are removed.
The estimated share of that new money that remains after local businesses pay their non-local costs. The figure cities and funders truly care about.
You do not have to hide the whole event story inside one inflated headline number.
Quick to start. But formulas become hard to follow, versions multiply, and the logic ends up sitting with one person. Hard to defend, harder to repeat next year.
Useful when a major independent study is required. But expensive, and often too slow for testing every bid, funding case, or planning change — and the plan changes monthly.
Build the first estimate with the information you have. Improve it as the event develops. Keep the full logic visible from the first forecast to the final report.
This does not replace every consultant. For the very largest events, it is the preparation that makes a commissioned study sharper and cheaper — your assumptions arrive structured, not scattered.
Use the estimate to:

Created by major event strategist Jesse Kiuru and Host City Strategy, drawing on more than 25 years of experience across major events, host city strategy, bids, and event impact planning.
The calculator was built to solve a practical problem: How can an organiser or host city build a useful impact estimate early, keep improving it as the event develops, and still explain every major number at the end?
Jesse has worked both inside host cities and major event organisations, as well as in an advisory role. As project lead, he has contributed to winning bids including the FIS Nordic World Ski Championships 2017 and 2029 and MXGP Finland. He has also worked as event director for the FIS Nordic World Ski Championships 2017 and is currently project director for the Winter World Masters Games 2028 Finland.
The thinking behind the model is simple to say and hard to fake: Spending is not impact. Retention is.
Full access for your whole team, for a year. Unlimited events, unlimited scenarios, all reports, five users. Nothing metered.
Start Your First Estimate →€997 per year for one licence. It covers your whole team for the licence year, with free updates included. It starts with a 7-day free trial — a card is required, nothing is charged for seven days, and you can cancel anytime.
Unlimited. Model as many events as you like, and save as many scenarios per event as you need. Duplicate a calculation to test a variation without losing the original.
Five: you and up to four colleagues from your organisation. You invite them by email inside the app, and each gets their own login and workspace.
Because it only contains money you can trace. The model reports direct, first-round effects: no multipliers, no indirect or induced effects, internal transfers counted once, and local public funding not counted as new money. Where comparable studies report larger totals, the difference is typically multiplied or gross spending. A smaller number you can defend is worth more than a bigger one you cannot.
Yes — that is the normal case. You work with forecasts and assumptions, supported by expert defaults for VAT, leakage and spending behaviour. The model tracks which values are defaults and which are yours, and the estimate updates as better information arrives. You do not need perfect data. You need numbers you can explain.
Yes. Built-in VAT and sales-tax profiles cover Belgium, Finland, Germany, France, the UK, Sweden, Norway, Estonia and the United States (Illinois), with per-stream leakage and retention starting points. Every default can be overridden with your own figures.
Yes. The executive summary exports to Word and copies as plain text — most teams present the numbers in their own templates. The full report documents the complete logic and every assumption as a PDF.
The model is event-type agnostic. The three templates cover a continental sports championships, a city festival and an association congress. Visitor groups, spending streams and stakeholders are fully configurable, so the same logic applies to sport, culture and business events.
No. It structures the estimate and applies consistent rules. You own the assumptions, and the built-in checks tell you when they contradict each other. Your team makes the judgment — the model makes it defensible.
Your calculations are stored privately in your own account. Only your team sees them, and you can export everything to PDF or Word at any time.
Start with what you know today. Improve the assumptions as the event develops. Finish with a result you can explain — and stand behind.